



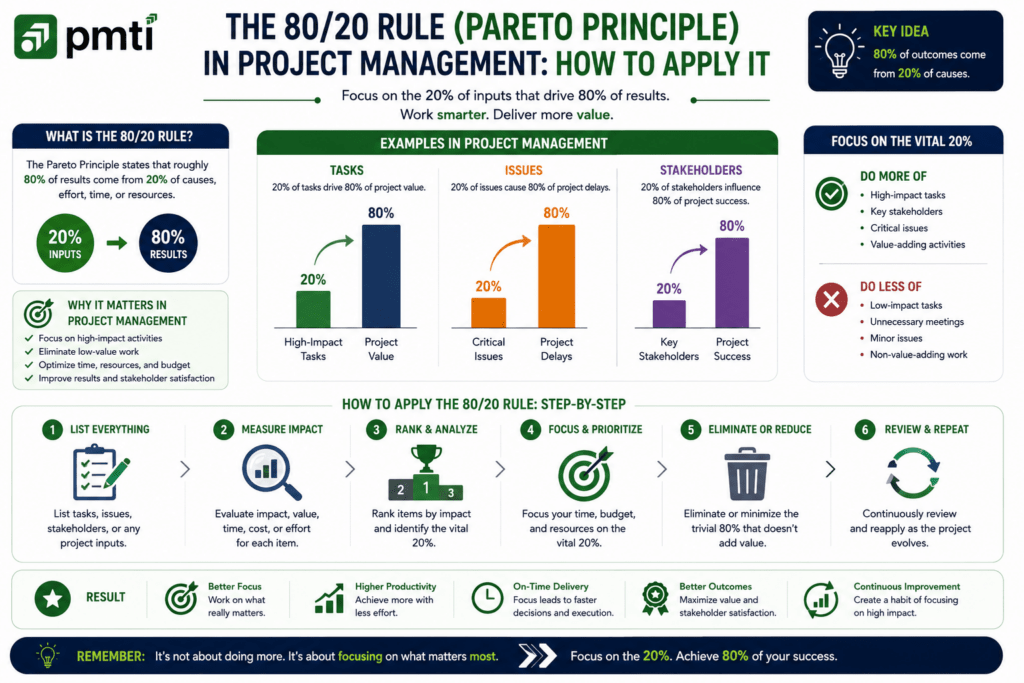
What Is the 80/20 Rule (Pareto Principle)?

The 80/20 rule has its origin in the work of the Italian Economist Vilfredo Pareto (1906) when he noted that 20% of Italy’s population owned 80% of the land. Joseph M. Juran, a contemporary of Pareto’s, created and worked to popularize the idea of “the vital few and the trivial many” to describe how a small number of causes will typically yield the majority of effects in a given situation.
How Does the 80/20 Rule Apply to Project Management?
The 80/20 rule in project management is noted in the fact that about 20% of the project tasks will, in combination, create the majority of the project’s value. The rest of the tasks will not, in combination, create much value. Recognizing which tasks are in this 20% value creation group will allow a project manager to distribute time and budget the way it should be focused, as opposed to assuming all tasks are of equal value.
How Do You Apply the 80/20 Rule to Prioritize Project Tasks?
Instead of viewing a task list as having high value versus low value tasks, the 80/20 principle suggests that you see tasks in terms of value and effort. This is due to the fact that value-versus-effort matrix reveals distinctions that a simplistic high-value versus low-value classification misses.
- Quick wins (high value, low effort) — prioritize these first; they deliver the most return for the least investment.
- Major projects (high value, high effort) — schedule these deliberately with adequate resources, since they matter significantly but require sustained investment.
- Fill-ins (low value, low effort) — complete these when capacity allows, but never at the expense of higher-value work.
- Thankless tasks (low value, high effort) — minimize or reconsider these, since they consume disproportionate resources for limited return.
A task landing in the “quick wins” quadrant should never sit behind a “thankless task” in the schedule simply because it was requested first — value and effort, assessed together, should drive sequencing more than request order does.
What Is a Pareto Diagram, and How Do You Use It?
A Pareto Diagram is a bar chart with a cumulative percentage line, used to show the most frequent causes of defects, delays, or complaints, along with the percentage of occurrences it accounts for. Rather than having the team evaluate a long list of causes of defects to determine what the most critical issues are, the Pareto Diagram makes the ‘vital few’ causes evident.
Consider a project team analyzing 340 customer complaints across six categories:
- Shipping delays: 145 (42.6% of total)
- Product defects: 98 (28.8%)
- Billing errors: 42 (12.4%)
- Customer service: 28 (8.2%)
- Packaging: 15 (4.4%)
- Other: 12 (3.5%)
Ranked and accumulated, shipping delays and product defects together account for 71.5% of all complaints (145 + 98 = 243 of 340), and adding billing errors brings the cumulative total to 83.8%. Real-world data rarely lands on an exact 80/20 split — this example needs three categories, not exactly two, to cross 80% — but the underlying pattern holds: a small handful of causes account for the large majority of the problem, and fixing shipping delays first delivers far more impact than addressing packaging complaints ever would.
What Are the Pros and Cons of Using the 80/20 Rule?
The 80/20 rule streamlines prioritization and resource allocation, but it carries real risk of oversimplifying complex problems and causing teams to neglect work that falls outside the identified “vital few.”
Pros:
- Identifies the specific tasks or issues most worth streamlining to reduce cost and timeline.
- Focuses limited resources on high-impact work rather than spreading effort evenly across every task.
- Improves team productivity by clarifying what actually matters most.
- Surfaces the root causes behind recurring problems through tools like the Pareto Diagram.
Cons:
- Oversimplifies genuinely complex problems that don’t reduce cleanly to a small number of dominant causes.
- Fits some projects poorly, particularly those where value is distributed more evenly across tasks.
- Ignores factors and variables outside the specific data set being analyzed.
- Risks neglecting the remaining 80% of tasks, some of which may be essential prerequisites for the high-value 20%.
What Are Real-World Examples of the 80/20 Rule in Project Management?
Project teams across industries apply the 80/20 rule to focus resources on the work most likely to drive outcomes, rather than spreading effort evenly across every task.
- A construction project team discovered that 20% of subcontractor task categories accounted for roughly 80% of all schedule delays, and focused proactive coordination specifically on those categories in subsequent phases.
- A product team found that 20% of a new release’s planned features accounted for roughly 80% of user adoption after launch, informing which features received continued investment in the next release cycle.
- A software team identified that a small handful of code modules accounted for the large majority of production defects, prioritizing refactoring effort on those modules over evenly distributed code review.
How Does the 80/20 Rule Appear on the PMP Exam?
A Pareto Diagram is a bar chart with a cumulative percentage line, used to show the most frequent causes of defects, delays, or complaints, along with the percentage of occurrences it accounts for. Rather than having the team evaluate a long list of causes of defects to determine what the most critical issues are, the Pareto Diagram makes the ‘vital few’ causes evident.
Sample Question 1
A project manager reviews a Pareto Diagram showing defect categories ranked by frequency. What should the project manager prioritize first? A) The category with the fewest occurrences, to clear it quickly B) The categories accounting for the largest share of total defects C) All categories equally, regardless of frequency D) Only categories reported by senior stakeholders
Sample Question 2
According to the 80/20 rule, what is generally true about a project’s task list? A) All tasks contribute equally to overall project value B) A small subset of tasks typically accounts for the majority of the project’s value C) The majority of tasks are always unnecessary D) Task value cannot be meaningfully compared
Sample Question 3
A task is assessed as high value but also high effort. According to a value-effort prioritization matrix, how should this task be handled? A) Deprioritized in favor of low-effort tasks regardless of value B) Scheduled deliberately with adequate resources, given its significant value C) Ignored entirely, since high effort makes it not worth pursuing D) Treated identically to a low-value, low-effort task
Sample Question 4
What is the primary purpose of a Pareto Diagram in project quality management? A) To track schedule variance over time B) To visually identify which few causes account for the majority of defects or problems C) To calculate the project’s budget at completion D) To assign tasks to team members
Answers: 1) B — Pareto analysis directs attention to the highest-frequency categories first, since addressing them delivers the greatest overall impact. 2) B — the core premise of the 80/20 rule is that a small subset of tasks drives most of a project’s total value. 3) B — high-value, high-effort tasks warrant deliberate scheduling and resourcing, not deprioritization. 4) B — a Pareto Diagram exists specifically to make the “vital few” causes of a problem visually apparent.
Frequently Asked Questions
Is the 80/20 Rule Always Exactly 80/20?
The 80/20 rule is more of a pattern than a strict proportion – a small amount of inputs result in a larger amount of outputs. It could be in the ratio of 70/30, 75/25 or 90/10. The exact ratio is not as important as the general pattern.
How Does the 80/20 Rule Relate to Root Cause Analysis?
The 80/20 rule is the basis of the Pareto analysis, a root cause analysis methodology which ranks the causes of a problem in the order of frequency or impact to determine the few causes that should be addressed first. This is one of the many methods of root cause analysis, and among others, the fishbone diagram is used.
Can the 80/20 Rule Be Applied to Risk Management?
The 80/20 rule is applicable to risk management since the risk registers of the majority of the projects indicate a small set of risks of high probability and high impact that account for most of the project’s risk exposure. This also applies to the prioritization of project risks where resources are allocated based on the outcomes of the majority of the tasks.
What Is the Difference Between a Pareto Diagram and a Regular Bar Chart?
A Pareto diagram includes a bar chart where the categories are ranked in order from the highest to the lowest frequency, and a straight line that represents the cumulative percentage value. A typical bar chart shows the value of each category in the chart. The cumulative line is used to show the point at which combining the values would equal 80% of the total value.


