


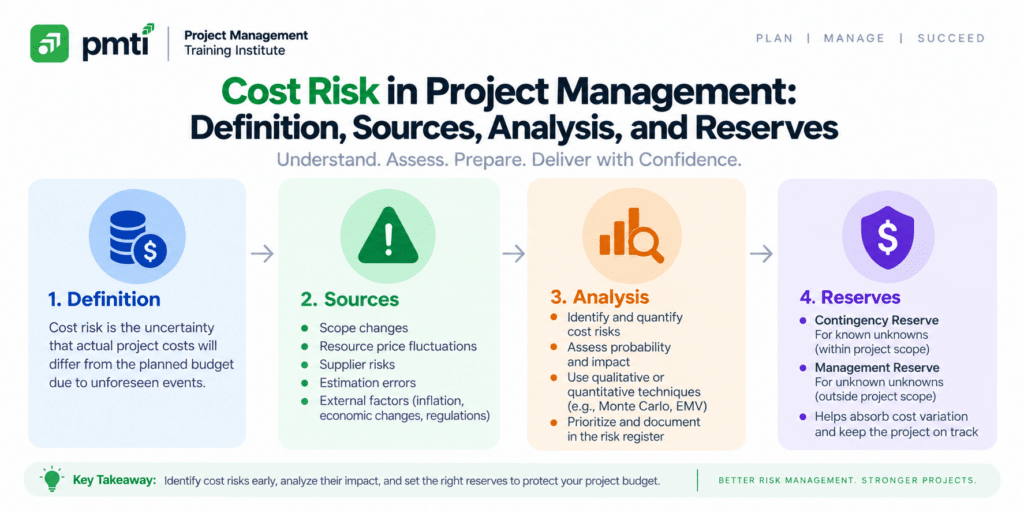
This guide defines cost risk, lists its sources, and shows how to analyze it, budget for it, and monitor it on a live project.
What Is Cost Risk in Project Management?

Cost risk is the possibility that actual project cost differs from the budget. A cost overrun is a threat. A cost saving is an opportunity. Cost risk is measured as a range around the estimate and priced as probability times impact.
Every cost estimate carries uncertainty, so every project carries cost risk. The size of that risk depends on estimate quality, scope stability, supplier terms, market conditions, and schedule performance.
Two ideas keep the topic clear. Cost risk is the exposure itself: a 30% chance of a $50,000 supplier price increase. The cost of risk is what the project spends to manage that exposure: the response actions, the premiums, and the reserves.
What Are the Main Sources of Cost Risk?
9 sources drive most cost risk: estimating error, scope change, schedule delay, resource price changes, currency and interest movements, supplier and contract terms, rework, regulatory and tax exposure, and staff turnover. Internal sources sit within the team’s control. External sources do not.
| Source | Type | How it raises cost | Example |
| Estimating error | Internal | Early estimates omit work or understate effort | A ROM estimate misses integration testing |
| Scope change | Internal | Added work with no added funding | Stakeholders add 3 features after baseline |
| Schedule delay | Internal | Time-related costs grow with every extra week | Each delayed week adds labor and equipment rental |
| Resource price change | External | Labor rates or material prices rise | Steel price increase after contract signing |
| Currency and interest movement | External | Foreign purchases and floating-rate financing cost more | A weaker home currency raises imported equipment cost |
| Supplier and contract terms | Both | Cost-reimbursable terms and vendor failure pass cost to the buyer | A supplier defaults and the project rebuys at spot price |
| Rework | Internal | Poor quality repeats work | Failed inspection forces a rebuild |
| Regulatory and tax exposure | External | New rules add compliance cost | A privacy regulation requires new controls |
| Staff turnover | Internal | Replacement hiring and ramp-up time | A key engineer resigns mid-project |
Classify each source along 2 more axes. Direct cost risks tie to project activities, such as rework. Indirect cost risks tie to support functions, such as PMO overhead and storage. The 3 axes together prevent blind spots.
Why Does Estimate Accuracy Drive Cost Risk?
Early estimates carry the widest uncertainty. The PMBOK Guide Sixth Edition gives a rough order of magnitude (ROM) estimate an accuracy of -25% to +75% and a definitive estimate -5% to +10%. Cost risk falls as scope definition improves.
| Estimate type | When prepared | Accuracy range | Range on a $1,000,000 estimate |
| ROM | Concept or feasibility | -25% to +75% | $750,000 to $1,750,000 |
| Budget estimate (common in practice) | Early planning | -10% to +25% | $900,000 to $1,250,000 |
| Definitive | Detailed planning | -5% to +10% | $950,000 to $1,100,000 |
A ROM estimate spans a $1,000,000 gap on a $1,000,000 project. Do not commit a budget baseline on a ROM estimate. Commit it on a definitive estimate, and hold the difference in reserves until then.
State the range beside every estimate. A number without a range hides the cost risk.
How Do You Analyze Cost Risk?
Analyze cost risk in 5 steps: identify risks, estimate each as a range, price probability and impact, run a simulation, and read the result as a confidence level. Techniques include three-point estimating, expected monetary value, sensitivity analysis, and Monte Carlo simulation.
- Identify every risk that affects cost, using the 9 sources above.
- Estimate each cost item as a range, not a single number.
- Price each risk with a probability and a cost impact.
- Run the numbers through a simulation, or through expected monetary value on a small project.
- Read the output as confidence levels, and set the budget at a level the sponsor accepts.
| Technique | What it does | Formula or output |
| Three-point estimate (triangular) | Averages optimistic, most likely, pessimistic | (O + M + P) ÷ 3 |
| Three-point estimate (beta or PERT) | Weights the most likely value | (O + 4M + P) ÷ 6 |
| Expected monetary value (EMV) | Prices each risk | Probability × impact |
| Sensitivity analysis | Ranks which inputs move total cost most | Tornado diagram |
| Monte Carlo simulation | Runs the cost model thousands of times | Cumulative probability curve (S-curve) |
Example: a work package has an optimistic cost of $40,000, a most likely cost of $50,000, and a pessimistic cost of $80,000. The triangular estimate is $56,667. The beta estimate is $53,333. The beta standard deviation, (P – O) ÷ 6, is $6,667.
A Monte Carlo run returns the probability of finishing at or below any cost. A 50% confidence level means an even chance of staying within that cost. An 80% confidence level means 4 chances in 5. The sponsor picks the level, and the gap between the 80% figure and the base estimate becomes the contingency reserve.
Time and cost move together. Every extra week of delay adds burn rate, so analyze schedule risk and cost risk in one model.
How Do You Calculate a Cost Risk Reserve?
Calculate the contingency reserve by summing the expected monetary value of each identified cost risk. Add it to the base estimate to form the cost baseline. Add the sponsor’s management reserve to form the project budget. Management reserve covers unidentified risks.
PMTI’s guide What is Expected Monetary Value in Project Management? explains the EMV calculation. Example:
| Risk | Probability | Impact | EMV |
| Supplier price increase | 30% | $50,000 | $15,000 |
| Scope change after baseline | 20% | $80,000 | $16,000 |
| Key engineer leaves | 15% | $60,000 | $9,000 |
| Currency swing on imported parts | 25% | $40,000 | $10,000 |
| Rework after failed inspection | 35% | $40,000 | $14,000 |
| Contingency reserve | $64,000 |
| Budget layer | Amount | Holder |
| Base cost estimate | $800,000 | Project manager |
| Contingency reserve (sum of EMV) | $64,000 | Project manager |
| Cost baseline | $864,000 | Project manager |
| Management reserve (example) | $40,000 | Sponsor or management |
| Project budget | $904,000 | Sponsor |
The contingency reserve sits inside the cost baseline, and the project manager draws on it for identified risks. The management reserve sits outside the baseline, and using it requires approval and a baseline change. The reserve is not designed to cover every risk in full. It moves the expected overrun to a level the sponsor accepts.
What Is the Cost of Risk and How Do You Budget for It?
The cost of risk is the total spent to manage a risk: response costs plus the exposure the project keeps. Budget response actions as work in the cost baseline. A response earns its cost when it removes more expected loss than it costs.
Total cost of risk equals response cost plus retained exposure. Example: a risk has a $60,000 impact at 30% probability, so its EMV is $18,000. A $7,000 mitigation action lowers the probability to 10%. Retained EMV falls to $6,000. The cost of risk is $7,000 plus $6,000, or $13,000, against $18,000 without the response.
Add each approved response to the schedule and the cost baseline as an activity with an owner. A response with no budget line does not happen.
Cost mitigation tactics map to the response strategies:
| Cost risk | Strategy | Tactic |
| Supplier price increase | Transfer | Sign a fixed-price contract, or add a price cap |
| Currency swing | Transfer or mitigate | Use a forward contract, or pay in the home currency |
| Estimating error | Mitigate | Use bottom-up estimates and independent review |
| Scope change | Avoid or mitigate | Enforce change control with a funding rule |
| Schedule delay | Mitigate | Buy float, add a second supplier, or crash critical tasks |
| Low-priority cost risk | Accept | Document it and hold reserve |
How Do You Monitor Cost Risk During Execution?
Monitor cost risk with earned value metrics and reserve tracking. Cost performance index (CPI) below 1.0 signals an overrun. The estimate at completion (EAC) forecasts the final cost. Compare the forecast overrun with the remaining reserve at every status review.
PMTI’s guide Forecasting Projects in Progress With EAC: Formulas, Examples, and PMP Exam Guide covers the forecast formulas in depth.
| Indicator | Formula | Signal |
| Cost variance (CV) | EV – AC | Negative means over budget |
| Cost performance index (CPI) | EV ÷ AC | Below 1.0 means over budget |
| Estimate at completion (EAC) | BAC ÷ CPI | Forecast final cost if current efficiency continues |
| Variance at completion (VAC) | BAC – EAC | Negative means a forecast overrun |
Example: budget at completion (BAC) is $500,000, earned value (EV) is $200,000, and actual cost (AC) is $250,000. CV is -$50,000. CPI is 0.80. EAC is $625,000. VAC is -$125,000. The project forecasts a $125,000 overrun. A remaining contingency reserve of $40,000 does not cover it. Escalate, and request a decision on scope, funding, or recovery actions.
Track the reserve like a bank balance. Record each draw, the risk it paid for, and the balance. Reassess the reserve at every phase gate.
What Mistakes Inflate Cost Risk?
5 mistakes inflate cost risk: single-point estimates, hidden padding inside tasks, reserves with no owner, separate cost and schedule analysis, and stale estimates after change requests. Each mistake hides exposure, weakens control of the reserve, or both.
| Mistake | Effect | Fix |
| Single-point estimates | No visible range, false certainty | State a range beside every estimate |
| Padding inside tasks | Hidden reserve that teams spend by default | Hold reserve in one visible line |
| Reserve with no owner | No one approves or tracks draws | Name an owner and a draw rule |
| Separate cost and schedule analysis | Delay costs go uncounted | Model time and burn rate together |
| Stale estimates | Baseline drifts from reality | Re-estimate after each approved change |
How Does Cost Risk Work in Agile and Hybrid Projects?
Agile and hybrid projects fix the budget and time-box the work, so cost risk shifts from estimate accuracy to scope throughput. Teams track burn rate and velocity, hold reserve as extra sprints, and re-forecast the remaining scope every iteration.
- Fund teams for a fixed period, and treat the budget as runway.
- Track burn rate against remaining backlog value at every sprint review.
- Hold a reserve of extra sprints or capacity for identified risks.
- Re-forecast completion each iteration, using velocity and the size of the remaining backlog.
- Fix predictive elements, such as vendor contracts, with price terms before work starts.
Approximately 60% of the July 2026 PMP exam targets agile or hybrid approaches, so exam scenarios pair these practices with predictive cost formulas.
How Is Cost Risk Tested on the PMP Exam?
PMP questions test reserve types, EMV, three-point estimating, and cost forecasts. Known risks map to the contingency reserve, unknown risks map to the management reserve, and a CPI below 1.0 signals an overrun that needs corrective action.
| Scenario cue | Answer |
| Identified risks need funding | Contingency reserve |
| Unidentified risks need funding | Management reserve, with approval |
| Total funding for known risks | Sum of EMVs |
| Estimates vary between best and worst case | Three-point estimate |
| CPI below 1.0 | Overrun; find the cause, then act |
| Forecast final cost | EAC |
| A reserve draw changes the baseline | Change control |
Cost risk connects the risk process to the cost process, so read each scenario for both.
PMTI’s Earned Value Management Course (24 PDUs) covers performance analysis, forecasting, and earned schedule for middle and upper management and for professionals with 5 to 6 years of project experience.
