


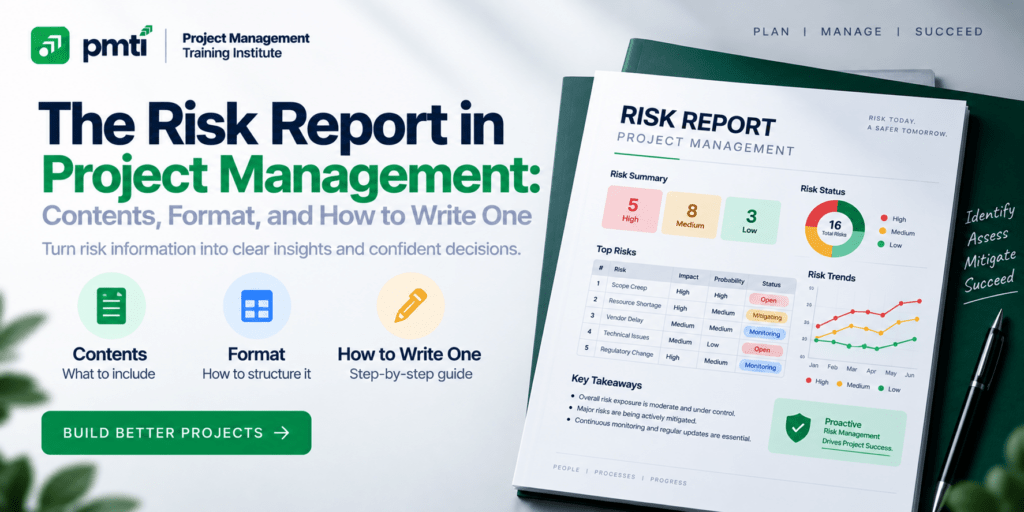
This guide covers what a risk report contains, how to write one step by step, which visuals to use, who reads it, when to issue it, and how it appears on the PMP exam.
What Is a Risk Report in Project Management?

A risk report is a project document that presents the sources of overall project risk, the current level of overall risk, and summary information on individual risks. It communicates risk status to stakeholders at a point in time and supports their decisions.
The PMBOK Guide Sixth Edition creates the risk report in Identify Risks and updates it in every later risk process. It draws on the risk register. The register lists every risk in detail for the team. The report turns that detail into a summary for readers who need a decision, not a data set.
Risk report, risk management report, and risk status report describe the same document. A risk analysis report is a related output: the numeric results of quantitative analysis. A later section covers it.
What Does a Risk Report Contain?
A risk report contains 9 sections: overall status, top risk drivers, top risks, trend, category distribution, response progress, occurred risks, reserve status, and decisions requested. Each section answers a question the reader would otherwise ask.
| Section | Content | Question it answers |
| Overall status | Red, amber, or green rating with a one-line reason | How risky is the project now? |
| Top risk drivers | The sources that contribute most to overall exposure | What drives the risk? |
| Top risks | The 5 to 10 highest-scoring risks with owner and response | Which risks matter most? |
| Trend | Change in open risks and total exposure since the last report | Is risk rising or falling? |
| Category distribution | Risks and exposure by category, such as technical or commercial | Where does risk concentrate? |
| Response progress | Status of planned actions, and overdue actions | Are the responses working? |
| Occurred risks | Risks that became issues, with cost and schedule impact | What already happened? |
| Reserve status | Contingency reserve approved, used, and remaining | Is there enough protection? |
| Decisions requested | Approvals, funding, or escalations needed | What do you need from us? |
Add an outlook line: the expected level of overall risk at the next reporting date.
How Do You Write a Risk Report Step by Step?
Write the report in 7 steps: define the reader and question, pull the data from the register, rank and summarize, add the overall view, state the decisions needed, apply the format, and check the numbers. Lead with the answer.
- Name the reader and the decision the report must support.
- Pull the current data from the risk register, not from memory.
- Rank the risks by score, and keep the top 5 to 10.
- Add the overall view: the status rating, the trend, and the reserve balance.
- Write the decisions and support requested, each with a date.
- Apply the project’s standard format, so every report looks the same.
- Check that every number matches the register and that the date is on the page.
Follow 5 writing standards:
- Lead with the overall status and its one-line reason.
- Define each color rating once, in a legend the reader sees.
- Name an owner beside every risk and every action.
- State units and the period covered on every number.
- Cut any section that does not change a decision.
Which Formats and Visuals Work Best in a Risk Report?
Use a status rating, a top-risks table, a heat map, and a trend chart. Each visual answers one question. Add a reserve gauge and a category chart when the reader needs them. Cut any visual that does not change a decision.
| Visual | Shows | Use when |
| Red, amber, green rating | Overall risk level | Always, at the top |
| Top-risks table | Ranked risks with owner and response | Always |
| Heat map | Count of risks in each probability and impact cell | The reader wants the shape of the exposure |
| Trend chart | Total exposure or open risks over reporting periods | Reports repeat over time |
| Category bar chart | Exposure by risk category | Risk concentrates in a few areas |
| Reserve gauge | Contingency reserve used against approved | Reserve is a decision topic |
| S-curve | Probability of reaching a cost or schedule target | Quantitative analysis exists |
Consistency beats novelty. Readers learn where to look, and a change in the pattern stands out.
Who Reads the Risk Report and What Do They Need?
The sponsor needs decisions, the steering committee needs escalations and trends, the PMO needs comparable data, and the team needs context. Match the length and detail to the reader, and follow the communications management plan for distribution.
| Reader | Needs | Length | Typical cadence |
| Sponsor | Overall status, decisions, reserve | 1 page | Each reporting cycle |
| Steering committee | Trends, escalations, top risks | 1 to 2 pages | Monthly or at gates |
| PMO | Comparable status across projects | Standard template | Monthly |
| Project team | Context for their own risks | Register plus a summary | Weekly |
| Customer | Risks named in the contract | As the contract requires | As agreed |
PMTI’s guide What is a Risk Register in Project Management? covers the register that feeds the report.
How Often Do You Issue a Risk Report?
Issue the risk report at each reporting interval, at each phase gate, and whenever a critical event occurs. The PMBOK Guide updates it in every risk process. Consistency matters more than the exact interval, so match the cadence to the sponsor’s decision cycle.
| Report type | Trigger | Content |
| Routine | Each reporting interval, often monthly | Full one-page report |
| Gate | Each phase gate | Full report plus the response results for the phase |
| Exception | A critical risk occurs, or a threshold is crossed | Short alert with impact and the decision needed |
Set the cadence in the risk management plan. PMTI’s guide Project Risk Management Process, Tools & Templates walks through the plan and the risk processes that update the report.
What Is a Risk Analysis Report?
A risk analysis report presents the numeric results of quantitative risk analysis: the probability of meeting cost and schedule targets, confidence-level figures from a simulation, and sensitivity to each risk. Its results feed the overall status in the risk report.
| Element | What it shows | Example (illustrative) |
| Probability of meeting the target | Chance of finishing at or below the budget | About 55% chance of finishing within $1,000,000 |
| Confidence-level costs | Cost at each confidence level | 50%: $985,000. 80%: $1,060,000. 90%: $1,110,000 |
| Sensitivity (tornado chart) | Which inputs move the result most | Supplier price 32%, scope change 24%, labor productivity 18%, currency 12%, other 14% |
| Contingency implied | Gap between a chosen confidence level and the base estimate | 80% level less $1,000,000 base = $60,000 |
The risk report carries the headline. It states the probability of meeting the target and the top drivers. The risk analysis report holds the method and the full output for readers who test it.
Which Incidents Go to the Risk Manager?
Report an incident to the risk manager when it crosses a defined threshold: exposure above the risk threshold, a high-priority trigger firing, an impact above tolerance, a legal, safety, or regulatory event, or a matter outside the project manager’s authority.
| Escalation criterion | Example | Route |
| Exposure above the risk threshold | A risk score rises above the agreed limit | Sponsor and risk manager |
| High-priority trigger fires | A supplier misses a critical milestone by 5 days | Sponsor |
| Impact above tolerance | An occurred risk pushes cost past the approved variance | Sponsor and steering committee |
| Legal, safety, or regulatory event | A data breach or a site injury | Risk manager, legal, and sponsor at once |
| Outside project manager authority | A response needs funding the project cannot approve | Sponsor |
| Near miss with high potential | A control failed but no loss followed | Risk manager |
Define the criteria and the reporting time in the risk management plan. One university risk management policy sets a 24 to 48 hour window for high-risk incidents. Hospital risk managers apply the same principle: adverse events such as wrong-site surgery go to the risk manager under a defined policy.
How Do Risk Reports Roll Up to Program and Portfolio Levels?
Project risk reports roll up into program and portfolio risk reports. The program report adds dependencies between projects. The portfolio or enterprise report compares total exposure with risk appetite and shows concentration by category. Each level uses the same definitions.
| Level | Focus | Key content | Reader |
| Project | Individual risks and overall project risk | Top risks, trend, reserve, decisions | Sponsor |
| Program | Cross-project dependencies and shared risks | Risks that span projects, benefit risks | Program board |
| Portfolio or EPMO | Exposure against appetite | Total exposure, concentration by category, top risks across projects | Executive committee |
Shared definitions make the roll-up work. If each project scores probability on a different scale, the portfolio report adds up disagreements.
What Mistakes Weaken a Risk Report?
6 mistakes weaken a risk report: dumping the whole register, omitting decisions, changing formats each period, using colors without definitions, hiding bad news behind a green rating, and reporting stale data. Each one costs the reader’s trust or time.
| Mistake | Effect | Fix |
| Dumping the whole register | The top risks are buried | Cut to the top 5 to 10 |
| No decisions requested | The report informs and moves nothing | End with a decision list |
| A new format each period | Readers cannot compare | Fix the template for the project |
| Colors with no definitions | Ratings mean different things to different readers | Add a legend |
| Green on top, red underneath | Bad news stays hidden until it is too late | Rate overall status from the worst top risk |
| Stale data | Readers act on old exposure | Date the report and refresh it from the register |
How Do Risk Reports Work in Agile and Hybrid Projects?
Agile and hybrid teams report risk in short, frequent forms: a risk section in the sprint review, a risk view in release readiness reviews, and a risk board at planning. The report keeps the same core: status, top risks, and decisions needed.
- Show the top risks and their trend in each sprint review.
- Include a risk view in every release readiness review.
- Use a risk board at program increment planning, with each risk marked resolved, owned, accepted, or mitigated.
- Escalate any risk that crosses the team’s threshold to the product owner or sponsor.
Approximately 60% of the July 2026 PMP exam targets agile or hybrid approaches, so exam scenarios use both vocabularies.
How Is the Risk Report Tested on the PMP Exam?
PMP questions test what the risk report contains, when it is created, and who reads it. The report presents overall project risk and summary information on individual risks. Identify Risks creates it, and every later risk process updates it.
| Scenario cue | Answer |
| A sponsor asks how risky the project is | Risk report |
| Which process creates the risk report | Identify Risks |
| Which processes update it | Qualitative, quantitative, plan responses, implement responses, monitor risks |
| A document lists sources of overall project risk | Risk report |
| The report lists each risk’s trigger and fallback plan | Risk register, not the report |
| The manager must tell stakeholders the status of risk | Risk report, distributed per the communications plan |
| An audit finds gaps | Findings appear in the risk report |
Read for the audience. Executive and overall points to the report. Detail and ownership points to the register.
PMTI’s Project Risk Management Course (24 PDUs) covers project risk management in depth for middle and upper management. Max Wideman, a PMI Fellow who led the first PMBOK Guide effort, designed the course and delivers it online.

