


What Is the Standard Deviation Formula?
The standard deviation formula used to calculate a PERT estimate is SD = (P – O) / 6, where P and O respectively refer to the pessimistic and optimistic estimates. This is just a simplified approximation of the full standard deviation formula that is based on the same Beta distribution as the PERT formula and not the more robust statistics standard deviation equation that is usually taught in traditional statistics classes.
How Do You Calculate Standard Deviation?
A project manager calculates standard deviation by subtracting the optimistic estimate from the pessimistic estimate and dividing the result by six.
Returning to the server migration task: Optimistic (O) = 8 hours, Most Likely (M) = 14 hours, Pessimistic (P) = 30 hours.
SD = (30 − 8) / 6 SD = 22 / 6 SD = 3.67 hours
This estimate carries a standard deviation of 3.67 hours around its PERT mean of 15.67 hours, calculated earlier using the PERT formula.
How Does Standard Deviation Relate to the PERT Mean?

Standard deviation and the PERT mean work hand and hand. The PERT mean supplies one single estimation value and standard deviation denotes how much that estimation value could change. Neither of these values provides the full picture. The mean without any measure of dispersion gives little indication of how much that value could change.
How Do You Build a Confidence Interval Using PERT and Standard Deviation?
A confidence interval is built by adding and subtracting multiples of the standard deviation from the PERT mean, producing a probability-based range instead of a single number.
Using the server migration estimate (PERT mean = 15.67 hours, SD = 3.67 hours):
- 68.3% confidence interval (±1 SD): 15.67 − 3.67 to 15.67 + 3.67 = 12.00 to 19.34 hours
- 95.5% confidence interval (±2 SD): 15.67 − 7.34 to 15.67 + 7.34 = 8.33 to 23.01 hours
- 99.7% confidence interval (±3 SD): 15.67 − 11.01 to 15.67 + 11.01 = 4.66 to 26.68 hours
A project manager can now state, with 95.5% confidence, that the migration task will take between 8.33 and 23.01 hours — a far more useful statement to a stakeholder than a single 15.67-hour estimate presented without any range.
What Do the Standard Deviation Confidence Bands Mean?
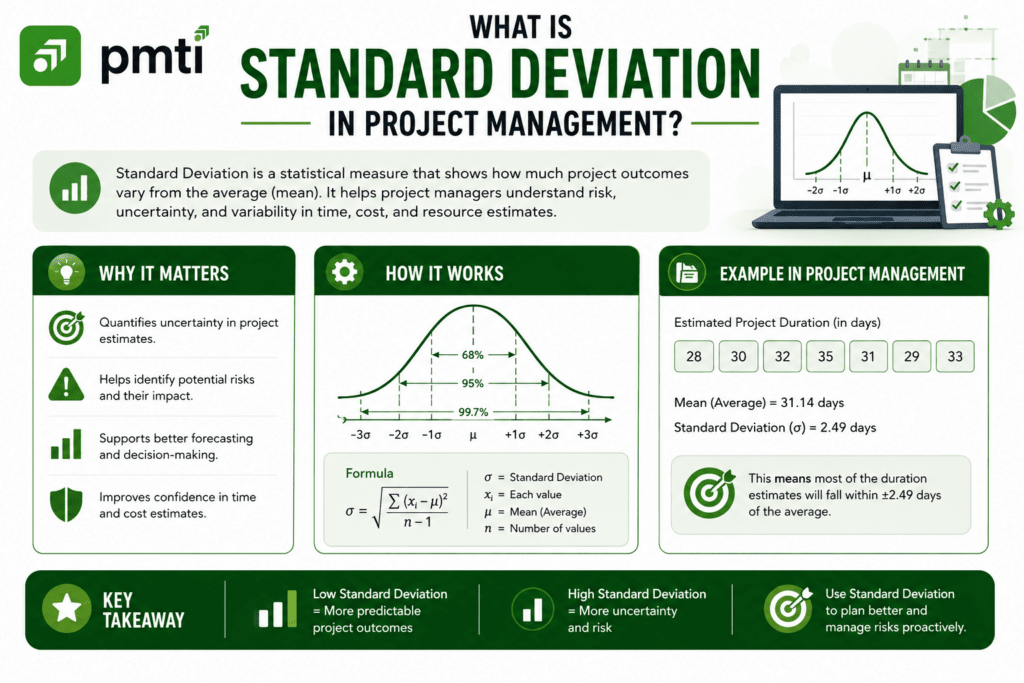
The standard deviation confidence bands follow the empirical rule: approximately 68.3% of outcomes fall within 1 standard deviation of the mean, 95.5% fall within 2 standard deviations, and 99.7% fall within 3 standard deviations.
- ±1 SD — approximately 68.3% probability, roughly 34.1% on either side of the mean.
- ±2 SD — approximately 95.5% probability, roughly 47.7% on either side of the mean.
- ±3 SD — approximately 99.7% probability, roughly 49.85% on either side of the mean.
When Is Standard Deviation Most Useful in Project Management?
Standard deviation is most useful for processes or tasks characterized by high repetition and low variance. For example, a manufacturing line with multiple units would yield a low standard deviation; a more unique and novel task like a one-time creative campaign would not.
How Does Standard Deviation Appear on the PMP Exam?
The PMP exam uses standard deviation in a calculation-based question and in interpretation-based questions that need probability as part of a confidence interval, at times partnered with a PERT mean calculation that would act as a distractor. There are a few questions that present all three components of O, M, and P values, whereas the question asks for the standard deviation, therefore candidates think they should provide the PERT mean response.
Sample Question 1: An activity has an optimistic estimate of 15 days, a most likely estimate of 22 days, and a pessimistic estimate of 41 days. What is the standard deviation? A) 4.33 B) 26 C) 13 D) 7.67
Sample Question 2: What is the approximate probability that an activity finishes within 2 standard deviations of its PERT mean? A) 68.3% B) 95.5% C) 99.7% D) 50%
Sample Question 3: A project’s PERT mean duration is 60 days, with a standard deviation of 5 days. What is the 68.3% confidence interval for completion? A) 50 to 70 days B) 55 to 65 days C) 45 to 75 days D) 58 to 62 days
Sample Question 4: An activity has an optimistic estimate of 12 days, a most likely estimate of 18 days, and a pessimistic estimate of 30 days. What is the standard deviation of this estimate? A) 19 B) 3 C) 6 D) 9
Answers: 1) A — SD = (41 − 15) / 6 = 26 / 6 = 4.33. 2) B — approximately 95.5% of outcomes fall within 2 standard deviations of the mean. 3) B — 68.3% confidence interval = 60 ± 5 = 55 to 65 days. 4) B — SD = (30 − 12) / 6 = 18 / 6 = 3; the PERT mean for this data (19) is a common distractor, not the standard deviation.
Frequently Asked Questions
Is Standard Deviation Part of the Official PMBOK Guide Lexicon?
For now, PMI doesn’t include standard deviation in their online lexicon, but in older versions of the PMBOK Guide, and in most preparation books for the PMP exam, the concept remains. It’s important to analyze estimate uncertainty and risk, and just because the lexicon doesn’t include it, doesn’t make it any less important.
Can Standard Deviation Be Calculated Without PERT?
Estimating projects requires PERT’s best and worst case scenario input, so, while the questions they answer are different, both calculations rely on the same data. With PERT, you get an estimate, and standard deviation puts a number to how uncertain it is.
What Is the Difference Between Standard Deviation and Variance?
Both standard deviation and variance provide a way to measure how spread apart values are from a mean. The difference is that standard deviation is expressed in the same unit of measurement as the original values, while variance is expressed in squared values. When estimating projects, standard deviation is the way to go, while variance will be more complex.
Why Doesn’t Standard Deviation Work Well for One-of-a-Kind Projects?
For standard deviation to have meaning, it needs many similar values; in a unique, never before done project, you won’t have those values, and applying the formula results in a value that may seem meaningful, but has no true value.


