


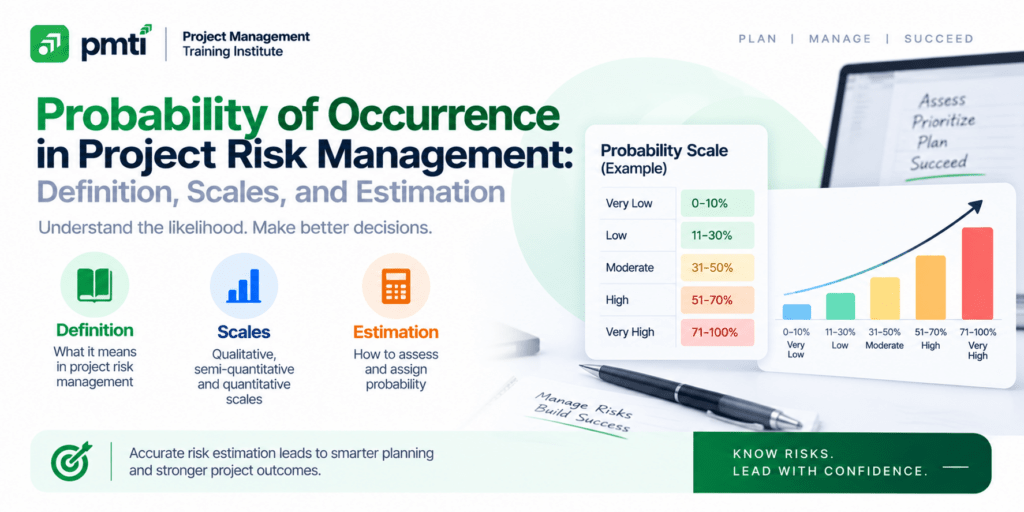
This guide shows how to determine the probability of occurrence, set a scale, combine several probabilities, control bias, and use the number in risk scoring, reserves, and the PMP exam.
What Is Probability of Occurrence in Risk Management?
Probability of occurrence is the likelihood that a specific risk event will happen, expressed as a number from 0 to 1 or a percentage from 0% to 100%. It is one half of a risk rating. The other half is impact.
Risk probability, risk likelihood, and probability of occurrence mean the same thing in project work. The team assesses it in the Perform Qualitative Risk Analysis process of the PMBOK Guide Sixth Edition and records it in the risk register.
Probability describes the event, not the consequence. A 5% chance of a $500,000 loss and a 50% chance of a $50,000 loss have very different probabilities and the same expected cost.
How Do You Determine the Probability of Occurrence?

Determine probability with 3 methods: a mathematical model, statistical analysis of historical data, or structured expert judgment. Use the strongest method the available data supports. Most project risks rely on expert judgment, so structure it to limit bias.
Risk researcher Tom Kendrick describes these 3 routes in a PMI conference paper on assessing risk probabilities.
| Method | When it applies | Example | Reliability |
| Mathematical model | The event follows known rules | Odds of a dice roll or a random equipment failure with a published failure rate | High |
| Historical data | Many similar past events exist | A supplier delivered late on 6 of its last 20 orders, so the estimate is 6 ÷ 20 = 30% | Medium to high |
| Expert judgment | Data is scarce or the event is rare | A panel estimates the chance that a regulator changes a rule | Medium, and bias-prone |
The frequency formula is simple: probability equals the number of times the event occurred divided by the number of opportunities. Insurers build their pricing on this method. Project teams use it wherever the organization keeps records of past projects, lessons learned, and vendor performance.
How Do Probability Scales Work?
A probability scale converts probability into levels the team can rate consistently. A qualitative scale uses words such as low, medium, and high. A quantitative scale uses numbers. Define every level in the risk management plan before scoring begins.
The PMBOK Guide’s example scale uses 5 probability levels with values of 0.10, 0.30, 0.50, 0.70, and 0.90. PMTI’s guide PMP Risk Assessment Matrix: How to Create Probability and Impact Matrix in Project Management uses 3 bands: high above 70%, medium from 30% to 70%, and low below 30%.
Nonlinear scales work better than equal steps. People judge the difference between 4% and 10% more reliably than the difference between 40% and 60%. Example scale, adapted from Kendrick’s suggested breakpoints:
| Level | Range | Planning value for calculations | Everyday comparison |
| Very low | 0% to 4% | 2% | Rolling a double six with 2 dice |
| Low | 4% to 10% | 7% | About 1 chance in 14 |
| Medium | 10% to 20% | 15% | Rolling a specific number on a die |
| High | 20% to 40% | 30% | Better than 1 chance in 5 |
| Very high | 40% to 100% | 70% | Close to a coin flip or better |
Set the time window in the definition. “Likely” means different things on a 2-week sprint and a 3-year program.
How Does Probability Combine With Impact?
Multiply probability by impact to get a risk score. With a monetary impact, the product is the expected monetary value (EMV). Rank risks by score, and treat high scores first. The score compares unlike risks on one scale.
The PMBOK Guide’s example uses a nonlinear impact scale of 0.05, 0.10, 0.20, 0.40, and 0.80. Scores follow from the product:
| Probability | Impact | Score | Reading |
| 0.70 | 0.40 | 0.28 | High priority |
| 0.50 | 0.20 | 0.10 | Medium priority |
| 0.10 | 0.10 | 0.01 | Low priority, watch list |
PMTI’s guide What is Expected Monetary Value in Project Management? explains the money version. Example: a risk with a 30% probability and a $60,000 impact has an EMV of $18,000. The sum of EMVs across identified risks sizes the contingency reserve.
Probability alone does not set priority. A 5% risk with a catastrophic impact can outrank a 50% risk with a trivial one.
How Do You Calculate the Probability of Several Risks Together?
For independent risks, multiply probabilities to find the chance that all occur. Multiply the complements to find the chance that none occur, then subtract from 1 to find the chance that at least one occurs. Probabilities of mutually exclusive outcomes add.
| Question | Rule | Example with 20%, 10%, and 30% |
| Chance the event does not occur | 1 – p | 1 – 0.30 = 0.70 |
| All 3 risks occur | p1 × p2 × p3 | 0.20 × 0.10 × 0.30 = 0.006, or 0.6% |
| None of the 3 occurs | (1 – p1) × (1 – p2) × (1 – p3) | 0.80 × 0.90 × 0.70 = 0.504 |
| At least 1 occurs | 1 – P(none) | 1 – 0.504 = 0.496, or 49.6% |
| Outcomes that cannot both happen | Add | Branches of one decision tree sum to 100% |
The result matters for planning. Three individually modest risks give a project a nearly even chance of at least one hit. Read the register as a portfolio, not as a list of separate small numbers.
How Does the Time Window Change the Probability of Occurrence?
A probability needs a time window. A risk with a 1% chance per week has an 18% chance across 20 weeks. Convert a per-period probability with 1 minus (1 minus p) raised to the number of periods.
| Window | Probability across the window at 1% per week |
| 4 weeks | 3.9% |
| 12 weeks | 11.4% |
| 26 weeks | 23.0% |
| 52 weeks | 40.7% |
Probability also moves with time. It falls to zero when the exposure window closes, such as after a supplier delivers or a permit is issued. It rises when a trigger fires. Re-rate each risk at every phase gate, not only at kickoff.
What Does “Per Occurrence” Mean?
Per occurrence means for each single event. In insurance, the per occurrence limit is the most an insurer pays for one event, and the aggregate limit is the most it pays across the policy period. Neither measures the chance of a loss.
The phrase matters when a project transfers risk through insurance. Example: a policy carries $1,000,000 per occurrence and $2,000,000 aggregate. A risk has a 5% probability and a $1,500,000 impact. The policy covers $1,000,000 of that event. The project keeps $500,000. The retained EMV is 5% × $500,000, or $25,000.
Read both limits against the risk register:
| Limit | What it caps | Check |
| Per occurrence | One event | Is the largest single impact above the limit? |
| Aggregate | All events in the period | Could 2 or more events exhaust it? |
An insurer defines “occurrence” in the policy. Related claims from one cause can count as a single occurrence.
How Do You Reduce Bias in Probability Estimates?
Reduce bias with 5 controls: collect estimates individually before discussion, use the Delphi technique, compare against historical data, challenge low outliers, and record each estimate with its reason. Bias usually pushes probability estimates down, so record each estimate with its reason.
Kendrick identifies optimism, anchoring, availability, and the confusion of plausibility with probability as the main biases.
| Bias | Effect on the estimate | Countermeasure |
| Optimism | Undesirable events look less likely | Ask for worst-case scenarios |
| Anchoring | The first number spoken pulls every later estimate | Collect estimates individually and in writing |
| Availability | Recent or vivid events look more likely than older ones | Review lessons learned from earlier projects |
| Plausibility vs probability | A believable story feels probable | Ask for the evidence behind each number |
| Groupthink | Estimates cluster around the senior voice | Use the Delphi technique with anonymous rounds |
Follow 5 steps:
- Ask each expert for a probability alone, with the time window stated.
- Collect the estimates without names.
- Share the spread, and ask the highest and lowest estimators for their reasons.
- Repeat the round until the estimates converge.
- Record the agreed value and the reasoning in the risk register.
Test a doubtful low estimate with a wager: ask whether the estimator will bet at those odds. At a 10% estimate, the estimator stakes $900 to win $100 by betting that the risk does not occur. People revise unrealistic numbers quickly when money is on the line, even hypothetical money.
When Do You Update the Probability of Occurrence?
Update the probability whenever new evidence arrives: a trigger fires, a test result comes in, a supplier performs, or the exposure window closes. Re-rate every risk at each phase gate. Log each change with its cause in the risk register.
| Event | Effect on probability |
| A trigger fires | Rises, often to near 1 |
| A mitigation completes | Falls |
| Test results confirm the design | Falls |
| A supplier misses a milestone | Rises |
| The exposure window closes | Falls to 0, and the risk closes |
| The event occurs | Becomes 1, and the risk moves to the issue log |
Track the estimate over time. A team that records predicted probabilities and actual outcomes learns whether its “30%” risks occur about 3 times in 10. That comparison is calibration, and it improves every later estimate.
How Do You Record and Use Probability in the Risk Register?
Record the probability value, its time window, the method behind it, the estimator, and the date beside every risk. Use the value with impact to select a response: accept low-low risks, mitigate high-probability low-impact risks, and transfer or plan for low-probability high-impact risks.
| Register field | Entry |
| Probability | 30% |
| Time window | Through the end of testing, week 20 |
| Method | Historical data, 6 late deliveries in 20 orders |
| Confidence | Medium |
| Estimator and reviewer | Procurement lead and project manager |
| Date | Re-rated at each phase gate |
The method and confidence fields let a reader judge the number. A 30% from 20 recorded deliveries carries more weight than a 30% from a single opinion.
Probability also drives the choice of response. A high probability points to prevention. A low probability with a severe impact points to insurance or a reserve. The full set of responses sits in the risk response strategies, and the threshold in the risk management plan sets where a risk stops being acceptable.
How Is Probability of Occurrence Tested on the PMP Exam?
PMP questions test the definition of probability, its role in the risk score and EMV, the range from 0 to 1, and the methods that reduce bias. Probability assessment sits in Perform Qualitative Risk Analysis.
| Scenario cue | Answer |
| The likelihood that a risk event occurs | Probability |
| Probability multiplied by impact | Risk score, or EMV when impact is money |
| A probability above 1 or below 0 | Invalid; probability runs from 0 to 1 |
| Branch probabilities in a decision tree | Sum to 1, or 100% |
| Experts give anonymous estimates over several rounds | Delphi technique |
| A team needs a shared meaning for “high” | Defined probability scale in the risk management plan |
| Probability is assessed after identification | Perform Qualitative Risk Analysis |
Read each question for units. A percentage of 40 and a decimal of 0.40 are the same value, and the exam mixes both.
PMTI’s Project Risk Management Course (24 PDUs) covers project risk management in depth for middle and upper management. Max Wideman, a PMI Fellow who led the first PMBOK Guide effort, designed the course and delivers it online.

