


What is Cost Variance (CV) in Project Management?
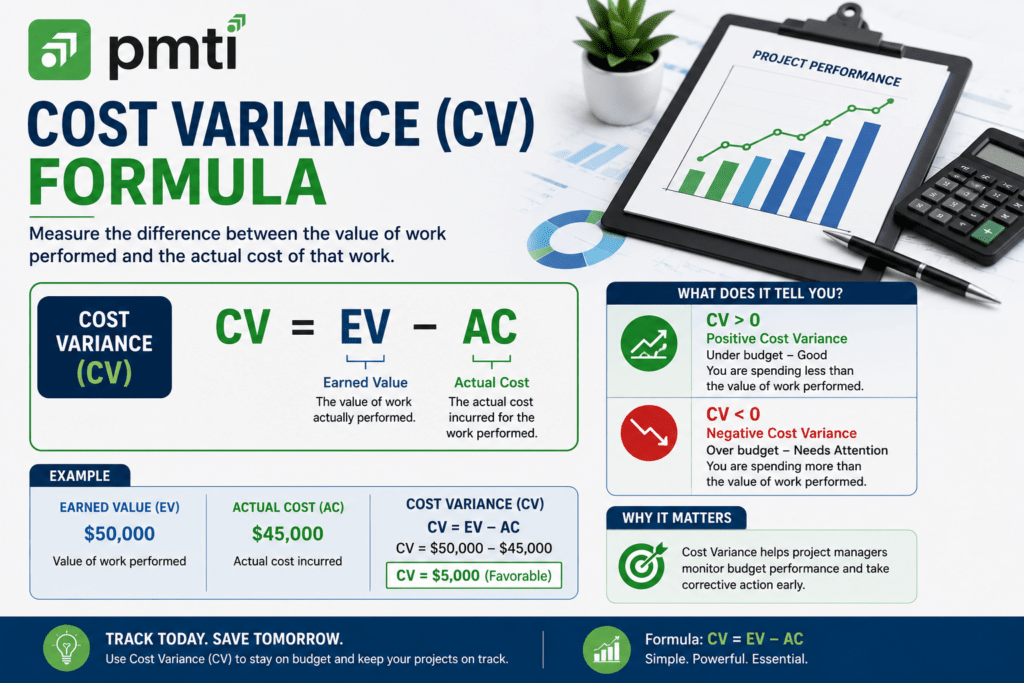
Cost Variance, CV, is the dollar difference between Earned Value, EV, and Actual Cost, AC, and is used within Project Cost Management to ascertain the current budget status of the project.
What Is the Cost Variance Formula?
The Cost Variance Formula is CV = EV – AC. Both EV and AC must have the same reporting date for the calculation to be meaningful.
How Do You Calculate Cost Variance?
The Project Manager subtracts Actual Cost from Earned Value for the period being reported to determine the Cost Variance.
A marketing campaign project has a budget of $80,000. At the reporting date, the team has completed 40% of the planned work at a cost of $36,000.
EV = 40% × $80,000 = $32,000 AC = $36,000 CV = $32,000 − $36,000 = −$4,000
A CV of −$4,000 indicates the project is currently $4,000 over budget relative to the value of work completed.
How Do You Interpret Cost Variance?
A positive CV indicates that the project is under budget. A negative CV indicates that the project is over budget. A cost variance of zero indicates that the project is precisely as budgeted. A cost variance of zero rarely occurs in practice because it is nearly impossible for actual spending to match earned value exactly.
- CV < 0 — the project is over budget; more was spent than the value of work completed.
- CV > 0 — the project is under budget; less was spent than the value of work completed.
- CV = 0 — the project is exactly on budget.
What Is the Difference Between Point-in-Time and Cumulative Cost Variance?

A point-in-time cost variance analysis examines one reporting period in isolation, while a cumulative cost variance analysis examines reporting period cost variance analysis in their entirety, and the variance of the two types of analysis can differ considerably even for the same project. During a given reporting period, a positive cumulative cost variance can mask a major cost overrun if a subsequent reporting period balances the overrun.
A project has a $12,000 budget tracked monthly:
- Month 1: 10% cumulative complete, $1,000 cumulative spent. Cumulative EV = $1,200. Cumulative CV = $1,200 − $1,000 = +$200.
- Month 2: 22% cumulative complete, $2,700 cumulative spent. Cumulative EV = $2,640. Cumulative CV = $2,640 − $2,700 = −$60.
- Month 3: 35% cumulative complete, $4,000 cumulative spent. Cumulative EV = $4,200. Cumulative CV = $4,200 − $4,000 = +$200.
Isolating Month 2’s point-in-time performance tells a sharper story. Work completed that month alone was 12% (22% − 10%), and money spent that month alone was $1,700 ($2,700 − $1,000).
Point-in-Time EV (Month 2) = 12% × $12,000 = $1,440 Point-in-Time CV (Month 2) = $1,440 − $1,700 = −$260
Month 2 ran $260 over budget on its own, a signal the cumulative CV alone never revealed, since Month 3’s strong performance offset it in the running total.
How Does Variance at Completion (VAC) Relate to Cost Variance?
Variance at Completion (VAC) has no relation to Cost Variance. VAC is a budget variance forecasted at the completion of the project, and it is computed as (BAC) – (EAC). Point-in-time and cumulative CV deal with performance to date. Variance at Completion (VAC) forecasts performance to date which has yet to occur. Mixing these as equivalents masks a distinction tested on the PMP exam.
How Does Cost Variance Relate to Cost Performance Index (CPI)?
Cost Variance quantifies performance of budget in dollar terms, whereas Cost Performance Index (CPI) gives the same data as an efficiency ratio calculated as CPI = EV / AC. A similar parameter, Cost Variance Percentage (CVP = CV / EV × 100), quantifies the dollar amount in percentage relative to each project.
How Does Cost Variance Compare to Schedule Variance (SV)?
Cost Variance isolates budget performance using EV and AC, while Schedule Variance isolates timeline performance using EV and PV, and a project can show favorable results on one measure while showing unfavorable results on the other. A project running under budget is not necessarily on schedule, and a project running on schedule is not necessarily on budget — the two variances must be read together for a complete performance picture.
What Causes Cost Variances?
Cost variance is primarily attributed to labor, materials, unanticipated cost, under/overestimating schedule, and unanticipated changes in overhead costs. Understanding what specifically caused the variance is the first step toward a remedial action.
- Labor cost variance occurs when actual hours worked or labor rates differ from the original estimate, often from underestimated task complexity.
- Material cost variance occurs when raw material or supply costs shift due to market pricing changes or unexpected waste.
- Unplanned damage or rework occurs when equipment failure, errors, or accidents require unbudgeted repair or replacement spending.
- Overhead cost variance occurs when shared costs such as facilities, utilities, or administrative overhead run higher than planned.
What Common Mistakes Do Project Managers Make With Cost Variance?
The most common of these mistakes are confusing Cost Variance (CV) with Cost Percentage (CPI), treating Variance Available (VAC) as a period-based CV, and analyzing Cost Variance (CV) on a cumulative basis without considering it period by period. Each of these mistakes has the potential of masking a significant budget concern within an apparently satisfactory cost performance indicator.
- Confusing CV, a dollar figure, with CPI, a ratio — the two are related but not interchangeable.
- Classifying VAC as a type of Cost Variance rather than a distinct end-of-project forecast.
- Reviewing only cumulative CV, missing a single bad period masked by strong performance elsewhere.
- Identifying a negative CV without following up with root-cause analysis and corrective action.
How Does Cost Variance Appear on the PMP Exam?
The most common of these mistakes are confusing Cost Variance (CV) with Cost Percentage (CPI), treating Variance Available (VAC) as a period-based CV, and analyzing Cost Variance (CV) on a cumulative basis without considering it period by period. Each of these mistakes has the potential of masking a significant budget concern within an apparently satisfactory cost performance indicator.
Sample Question 1: A project has AC = $18,500 and EV = $17,200. What is the Cost Variance, and what does it indicate? A) $1,300; the project is under budget B) −$1,300; the project is over budget C) $1,300; the project is over budget D) −$1,300; the project is under budget
Sample Question 2: A project is budgeted at $90,000 across 6 equal months. At the end of month 2, the project is exactly on schedule, and $32,000 has been spent. What is the Cost Variance? A) $2,000 B) −$2,000 C) $30,000 D) $32,000
Sample Question 3: A project manager reports a cumulative CV of +$500 through month 4, but month 4’s point-in-time CV alone is −$1,200. What does this indicate? A) The project has no budget concerns at all B) Prior months performed well enough to offset a real overrun in month 4 C) The calculation contains an error, since both figures cannot be true D) Month 4’s overrun means the cumulative CV is also negative
Sample Question 4: A stakeholder asks for the project’s forecasted budget variance at completion, not its current cost performance. Which metric should the project manager provide? A) Cumulative CV B) Point-in-time CV C) CPI D) VAC
Answers: 1) B — CV = EV − AC = $17,200 − $18,500 = −$1,300, indicating the project is over budget. 2) B — with the project on schedule at month 2 (33.3% complete), EV = $30,000; CV = $30,000 − $32,000 = −$2,000. 3) B — cumulative CV can remain positive even when a specific period runs over budget, if earlier periods performed well enough to offset it. 4) D — VAC is the forward-looking forecast of budget variance at project completion, distinct from CV, which measures performance to date.
Frequently Asked Questions
Is Cost Variance the Same as Cost Performance Index?
Cost Performance Index, or CPI, and Cost Variance, or CV, describe the same fact in different formats. CV describes budget performance in dollar terms of EV − AC, while CPI defines the same in a format of EV/AC. Large CV can be inconsequential, while the CPI can be very high or very low, depending on the scale of the project.
Can Cost Variance Be Zero?
If Earned Value and Actual Cost are the same, then Cost Variance is zero, however, this is a very rare find from the perspective of actual project data. A significantly close to zero Cost Variance indicates excellent control over the budget.
What Does a Negative Cost Variance Mean for a Project’s Future?
Negative Cost Variance implies to the project manager that their project is over budget. The consequence is that the project’s budget forecast will remain over the originally planned or allocated budget, unless the budget variance that drove the cost overrun is addressed.
Is Variance at Completion a Type of Cost Variance?
Variance at completion is not a type of cost variance. It is a forecasting metric calculated at the end of the project and is the difference of the budget at completion (BAC) and the estimate at completion (EAC). Many candidates taking the PMP exam get confused and use Variance at completion (VAC) in the same way as they do point in time (CV) or cumulative CV.

